Features
Dashboard
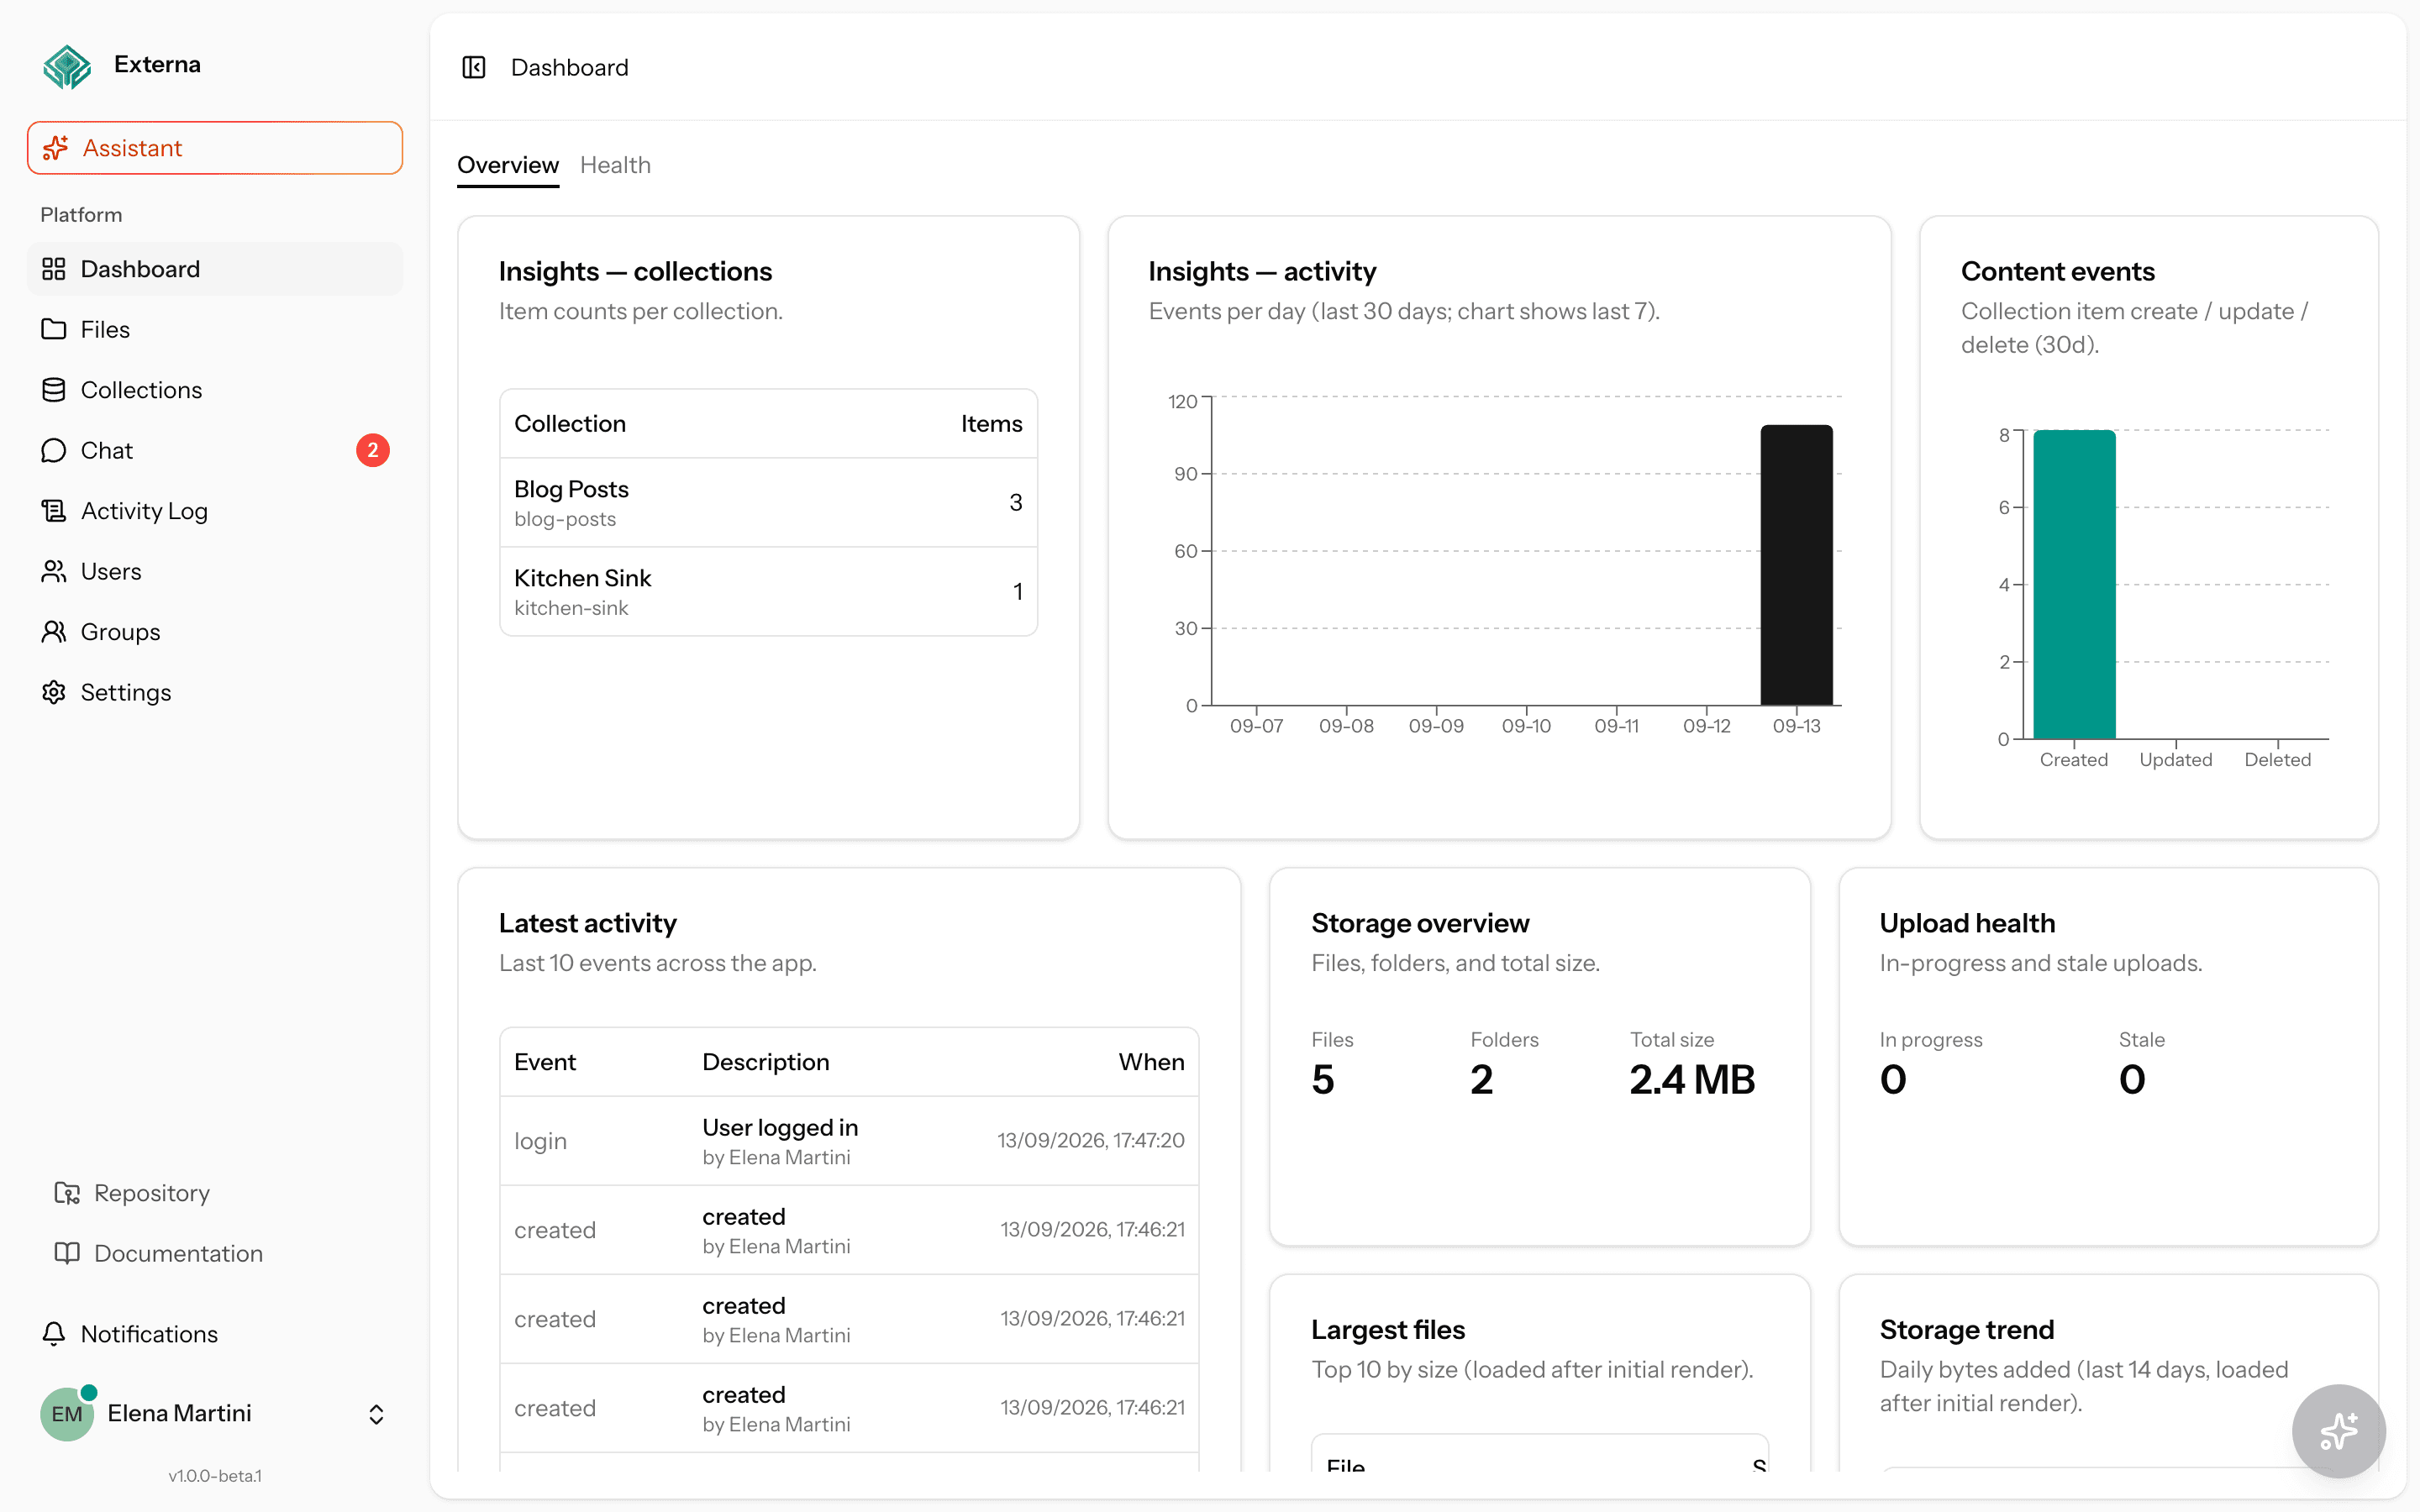
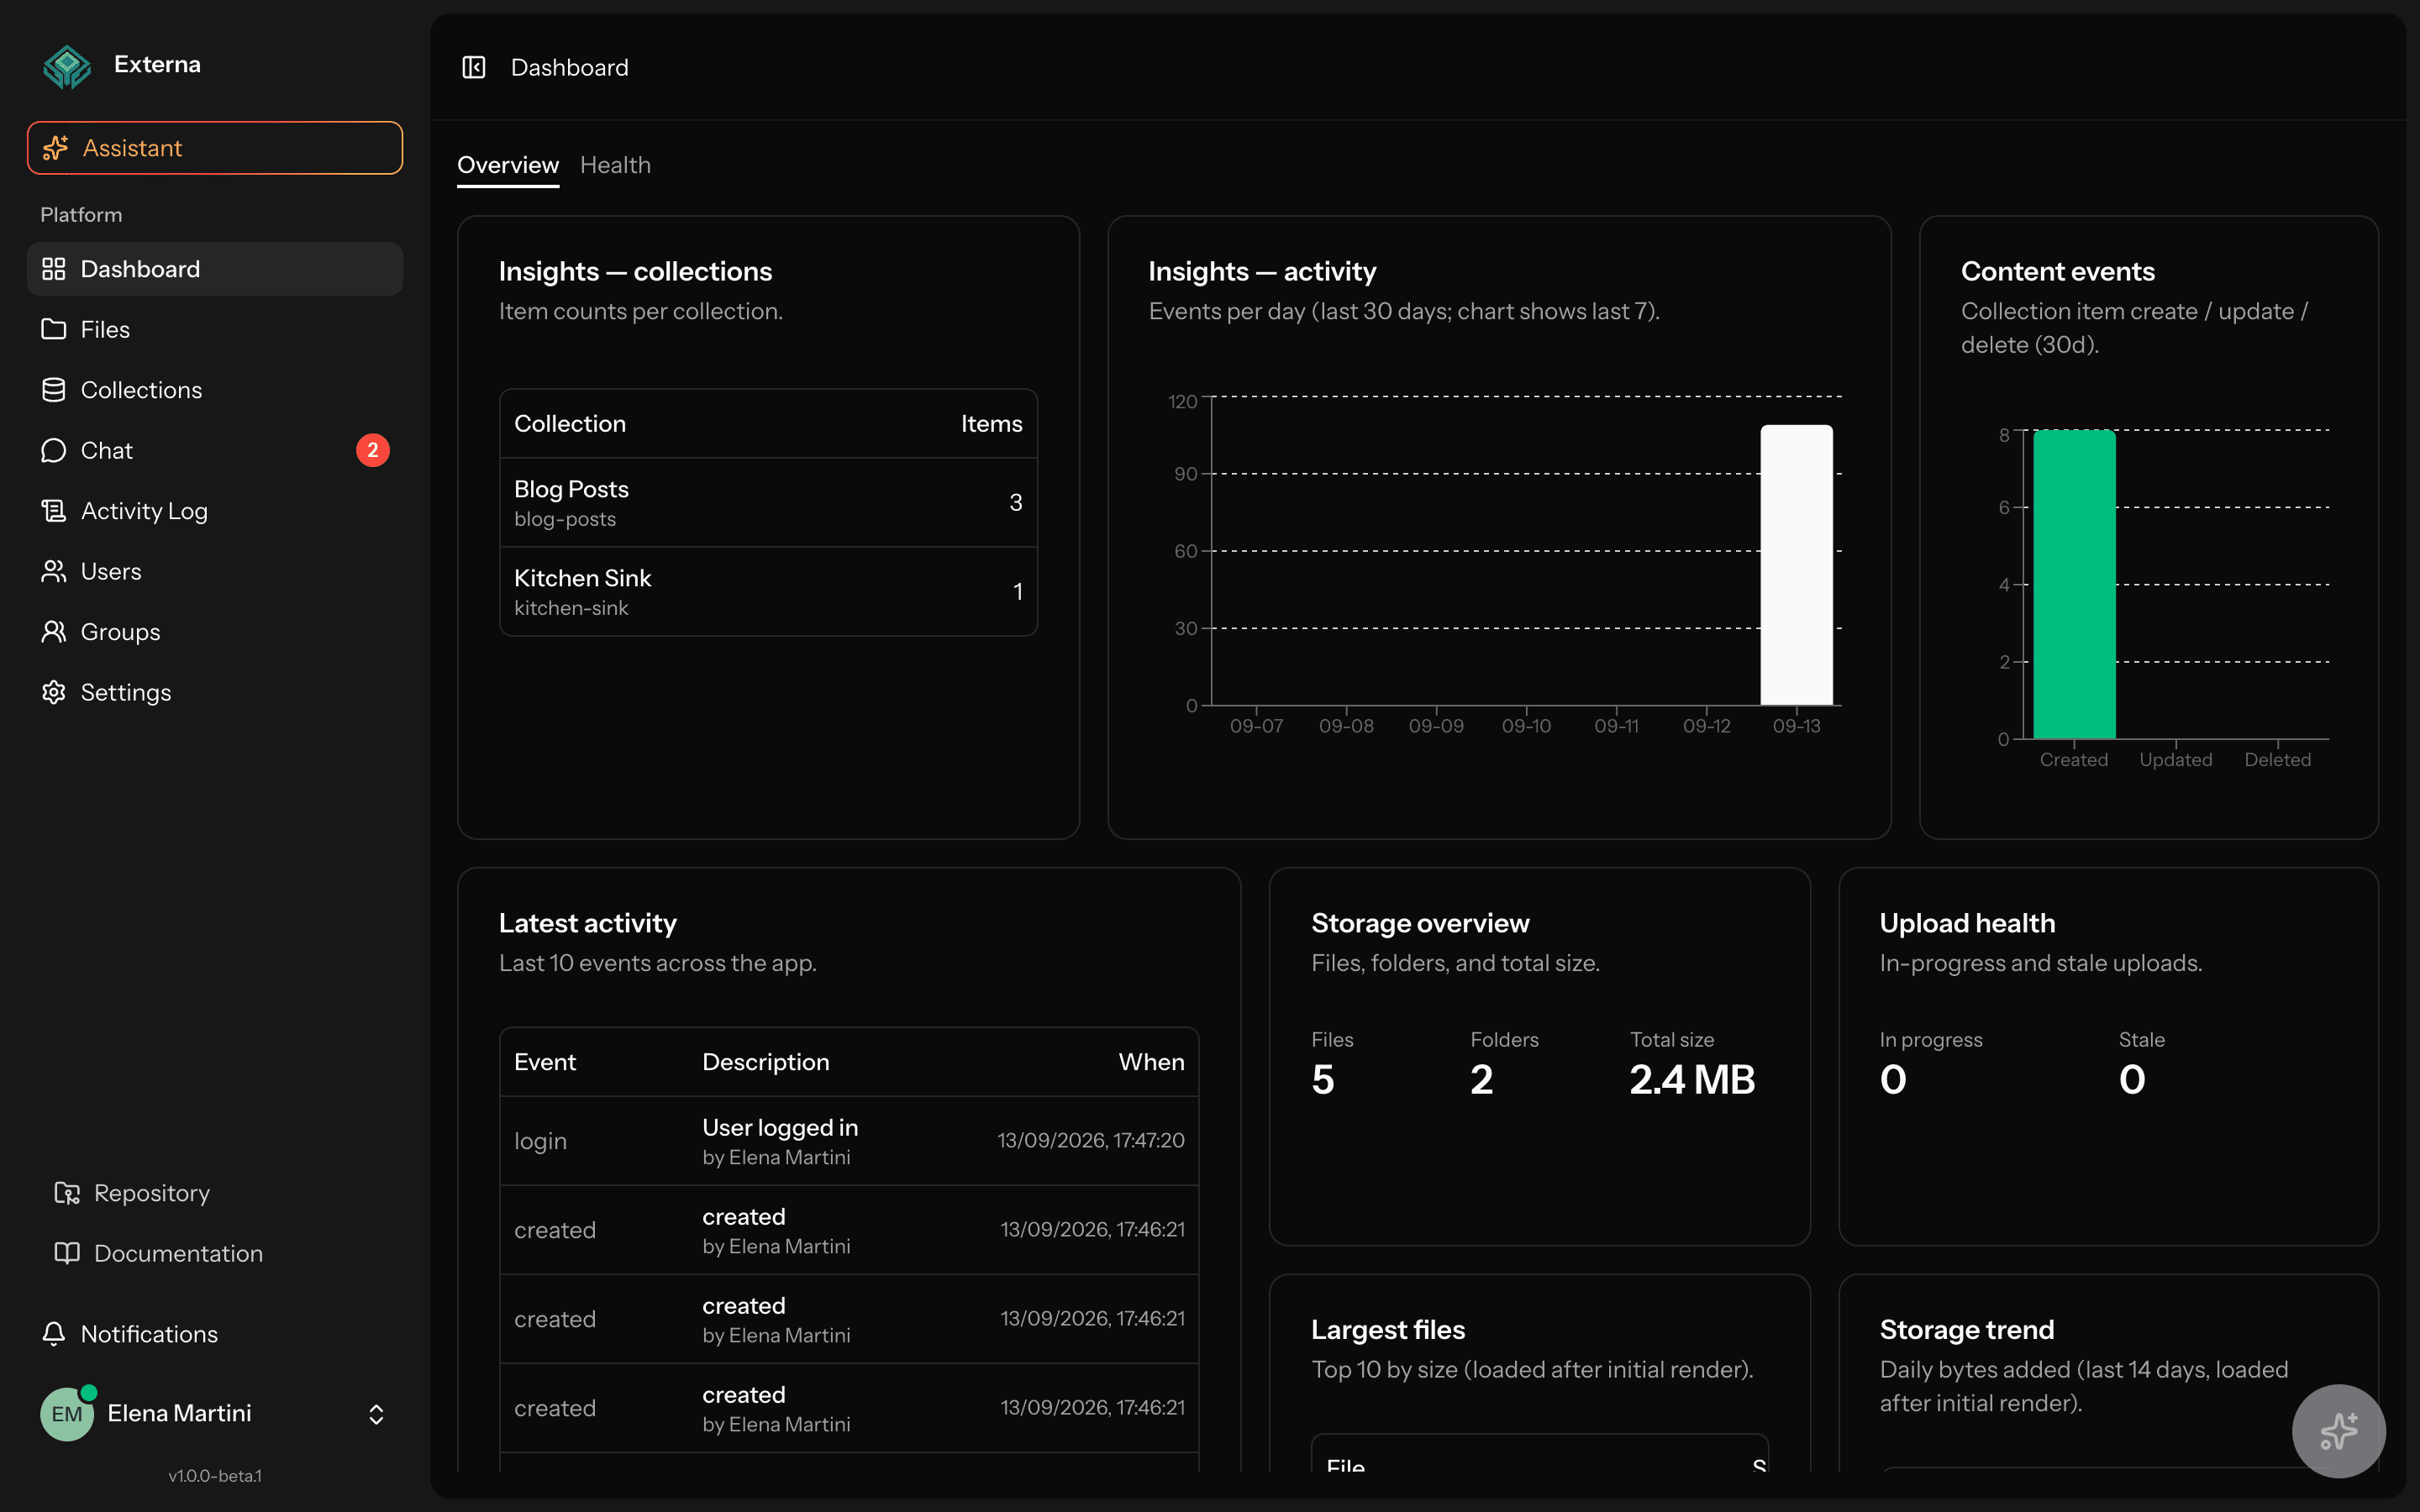
The dashboard is the Fortify home page: DashboardController renders Inertia dashboard with cached activity, storage, upload-health, Insights MVP widgets, and a Health tab fed by DashboardHealthMetrics. Access requires can-show-dashboard.
Related
Authorization: Effective permissions. Activity: Activity & notifications. Ops stack: Pulse & Health · Horizon · Reverb & Echo.
Access
| Item | Detail |
|---|---|
| Controller | App\Http\Controllers\DashboardController |
| Method | index |
| Route | GET /dashboard (dashboard) |
| Middleware | auth, verified, permission:can-show-dashboard |
| Permission | can-show-dashboard (PermissionEnum::CanShowDashboard) |
| Frontend | resources/js/pages/dashboard.tsx |
| Defined in | routes/web.php |
Unauthenticated visitors never reach this page; Fortify’s home path is /dashboard.
Tabs: Overview | Health
Compact inline tabs (underline, same row as the description) switch content. There are no primary “Open Pulse” / “Open Horizon” CTAs on the Health tab — metrics render as native Externa cards/charts. Livewire UIs at /pulse and /horizon remain for super-admin deep dives only (bookmark / type URL).
| Tab | Contents |
|---|---|
| Overview | Insights / activity / storage / upload-health widgets (below) |
| Health | Native cards from DashboardHealthMetrics (system + Pulse aggregates + Horizon/Redis queue) |
Deep-link: /dashboard?tab=health opens the Health tab. Switching tabs updates the query via history.replaceState.
Authenticated Inertia pages still share healthBadge (ok / warn / fail + label) from DashboardHealthMetrics::badge() (cached ~60s) for clients that need it; there is no sidebar chrome entry — open Health from the Dashboard tab. Fail when Redis is down or Horizon masters are stopped; warn when failed jobs / exceptions / Horizon failed counts are non-zero.
See also Pulse & Health tab.
Overview widgets
DashboardController builds Inertia props from Eloquent / Spatie Activity queries wrapped in Cache::remember. There is no dedicated dashboard service class for Overview. There is no Insights panel builder — fixed MVP panels only.
Insights MVP (~60s cache)
| Prop | Cache key | Contents |
|---|---|---|
collectionCounts | dashboard:collection-counts | Each collection’s items_count via withCount('items') |
activityOverTime | dashboard:activity-over-time:30d | Daily activity counts for the last 30 days |
contentEventBreakdown | dashboard:content-event-breakdown:30d | created / updated / deleted counts for CollectionItem subjects (30d) |
Charts use Recharts (last 7 days of activityOverTime + event breakdown bars).
~60 second cache (ops widgets)
| Prop | Cache key | Contents |
|---|---|---|
latestActivity | dashboard:latest-activity | Last 10 Spatie\Activitylog\Models\Activity rows with causer/subject |
fileStats | dashboard:file-stats | files_count, folders_count, files_size_sum from App\Models\File by FileTypeEnum |
uploadHealth | dashboard:upload-health | in_progress_count, stale_count from App\Models\FileUpload |
mostActiveUsers | dashboard:most-active-users:24h | Top 5 activity causers in the last 24 hours |
suspiciousEvents | dashboard:suspicious-events:1h | Last 25 activities with event = 'failed' in the last hour |
stuckOrphanUploads | dashboard:stuck-orphan-uploads | Up to 10 orphan / expired / stale uploads |
largestFiles | dashboard:largest-files | Top 10 files by size |
fileStatsByDisk | dashboard:file-stats-by-disk | Per-disk stats, loaded with Inertia::defer (group storage) |
TTL for these keys is 60 seconds.
Longer cache
| Prop | Cache key | TTL | Contents | | --- | --- | --- | | storageTrend | dashboard:storage-trend:14d | 1 hour | 14-day series of bytes added |
Cache nuance
Product copy often says “~60s widgets.” That matches activity, Insights, file counts/size, and upload health. The storage trend series is intentionally cached for one hour. This is not the notifications unread poll — that poll runs only when realtime broadcasting is off (Reverb & Echo).
Health tab (native metrics)
Prop health comes from App\Services\Dashboard\DashboardHealthMetrics::summary() (not Livewire). Empty / unavailable states show when Pulse tables or Horizon Redis APIs are missing.
System strip
| Field | Meaning |
|---|---|
queue_connection | config('queue.default') |
broadcast_connection | config('broadcasting.default') |
redis_ok | Redis::connection()->ping() |
pending_jobs | Database jobs count or Redis queues:{name} length |
failed_jobs | failed_jobs table count |
Pulse card + chart (24h aggregates)
Requires PULSE_ENABLED and pulse_aggregates table (pulse_available).
| Field | Pulse type |
|---|---|
exceptions_24h | exception |
slow_jobs_24h | slow_job |
slow_queries_24h | slow_query |
Also surfaces pulse_enabled / pulse_ingest for the card description. Quiet empty state when all three counts are zero.
Horizon card + workloads table
| Field | Meaning |
|---|---|
horizon.available | Horizon contracts resolvable |
horizon.status | running if master supervisors exist, else stopped |
horizon.pending / failed / processes | From workload + job repos |
horizon.jobs_per_minute / throughput | Metrics repository |
horizon.workloads[] | Per-queue name, length, wait, processes |
What each area answers
- Insights — collection size; activity volume; create/update/delete mix on content items.
- Activity — recent events and causers; failed auth under suspicious events.
- File counts / size — files, folders, bytes, largest files, optional per-disk breakdown.
- Upload health — in-progress and stale chunked uploads; stuck/orphan rows.
- Health — queue/broadcast/Redis status; Pulse exception/slow-job/slow-query volume; Horizon pending/failed/throughput/workloads.
Processes needed for Health data
| Process | Why |
|---|---|
php artisan horizon | Redis queue worker + Horizon metrics |
php artisan pulse:work | Drain Pulse redis ingest into aggregates |
Herd Reverb (or reverb:start) | Not required for Health metrics, but needed for Echo notifications/presence |
Source map
| Concern | Location |
|---|---|
| Controller | app/Http/Controllers/DashboardController.php |
| Health metrics | app/Services/Dashboard/DashboardHealthMetrics.php |
| Page | resources/js/pages/dashboard.tsx |
| Permission enum | app/Enums/PermissionEnum.php → CanShowDashboard |
| File model | app/Models/File.php |
| Upload model | app/Models/FileUpload.php |